
Series and read-through
Group your books into a series to see read-through, royalties per reader, and the most you can pay to acquire a reader who enters the series.
Why per-book profit lies for a series
A series is a funnel: a reader who buys book 1 often goes on to books 2, 3 and 4 with no further ad spend. That downstream income belongs to book 1's campaign, but no per-book view can show it.
Some authors deliberately run book 1 at a loss — permafree or $0.99 — to buy that reader. Others price it normally and it earns on its own. Either way, judged alone on Books book 1 is credited with none of what it started, so it reads worse than it is. This page fixes that.
Your series at a glance
The page opens on your series as covers — the first book in front, the next two behind it — with the two numbers that matter under each one: what a reader is worth, and how many readers get from book 1 to book 2.

They are ranked by royalties per reader, not by money earned. The table below already ranks by money; this row answers the other question — which funnel is worth feeding. Click any one to open its detail.
Creating a series
KDP has series — name, reading order, the "Book 2 of 5" line on Amazon — but it never sends any of it in the reports we read. So the grouping lives here.
To save you the typing, we read your titles first: something like The Dragon Heir (Ember Saga Book 2) is recognised, and Manage series proposes the whole group. One click to accept, and you only correct what is wrong.
You can also build one by hand: name it, add titles, and move them up or down into reading order. A book belongs to at most one series, and your grouping is yours — no sync ever touches it.
The series table
One row per series. The first three columns are the series ones:
| Column | Meaning |
|---|---|
| Readers | People who started the series over your date range |
| Read-through | Share of them who reached book 2 |
| Per reader | Royalties one reader generates across the whole series |
Then the money that decides something: royalties, ad spend and net profit. Same calculation as everywhere else in the app, so a series total is exactly the sum of its books on Books — KDP withholding tax, advertising VAT and per-day currency conversion already applied.
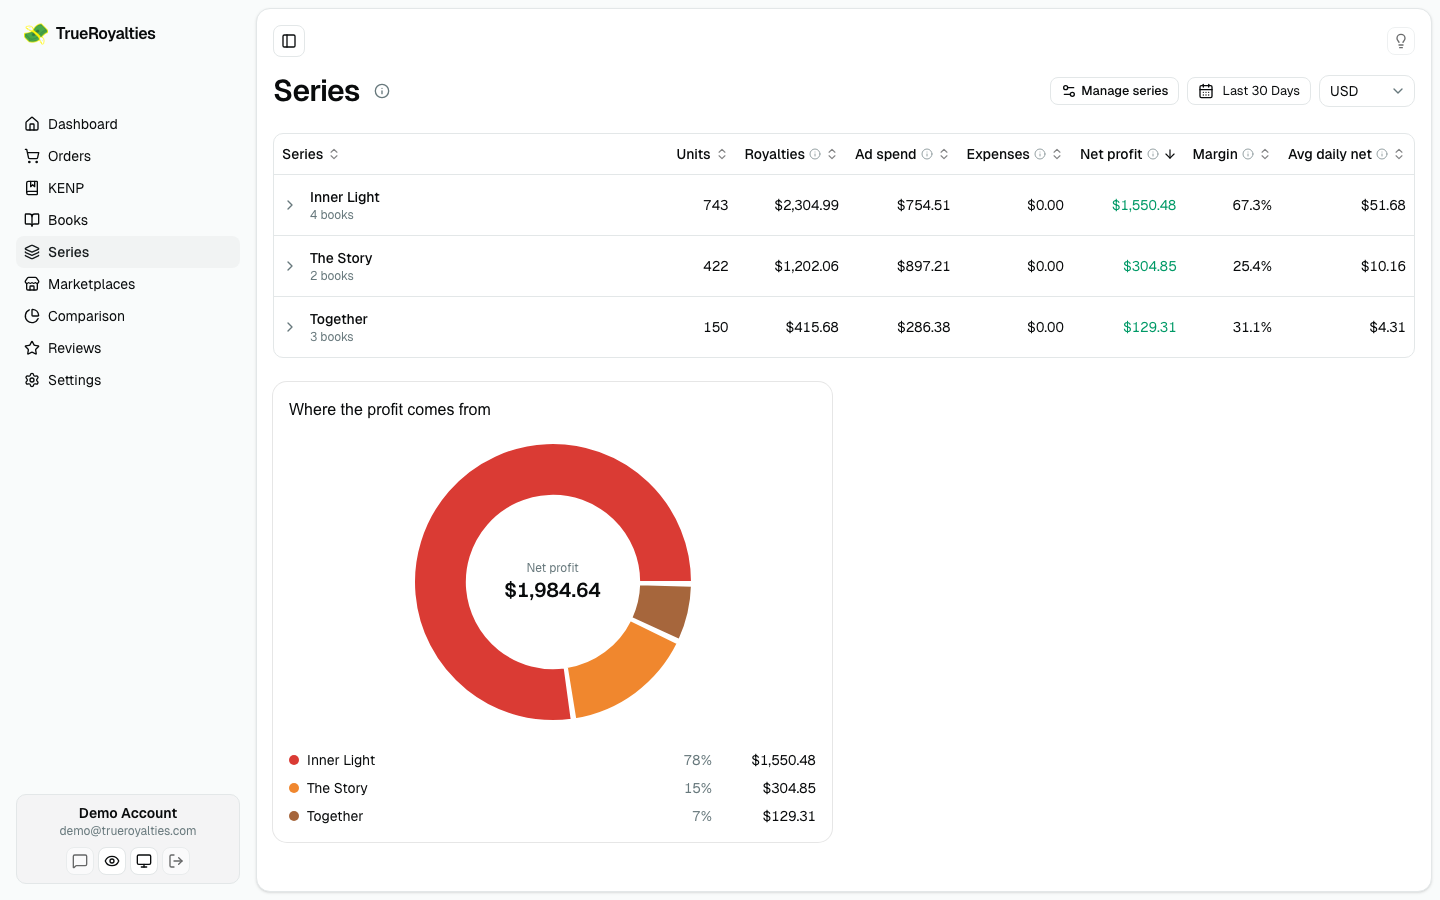
Columns adds the rest: units, expenses, margin and average daily net. They start hidden so the table fits your screen without scrolling sideways — nothing is removed, and your choice sticks while you are on the page.
Average daily net needs a date range to divide by, so it only appears when your range has a start and an end.
Opening a series closes the one you had open: one deep dive at a time, so the next row is always the next line and not a scroll away.
The donut at the bottom splits net profit between your series. Series losing money over the range are named under it rather than drawn as a slice — a negative share of a total means nothing.
Comparing every funnel at once
Under the table, one grid puts all your series side by side. The darker the cell, the more readers got that far — so the pale one tells you where a series loses people before you read a single number.

Two ways to read it, and they answer different questions:
- From book 1 — how many of your first-book readers reached this book. The number you quote: "31% make it to book 4".
- Book to book — how many of the previous book's readers reached this one. This is where a drop-off shows: a series can look healthy overall and still lose half its readers at one specific handover.
Show readers swaps the percentages for the counts they came from. Worth a click on a small series: 100% of four readers is not the same news as 100% of four hundred.
The detail of one series
Expand any row.
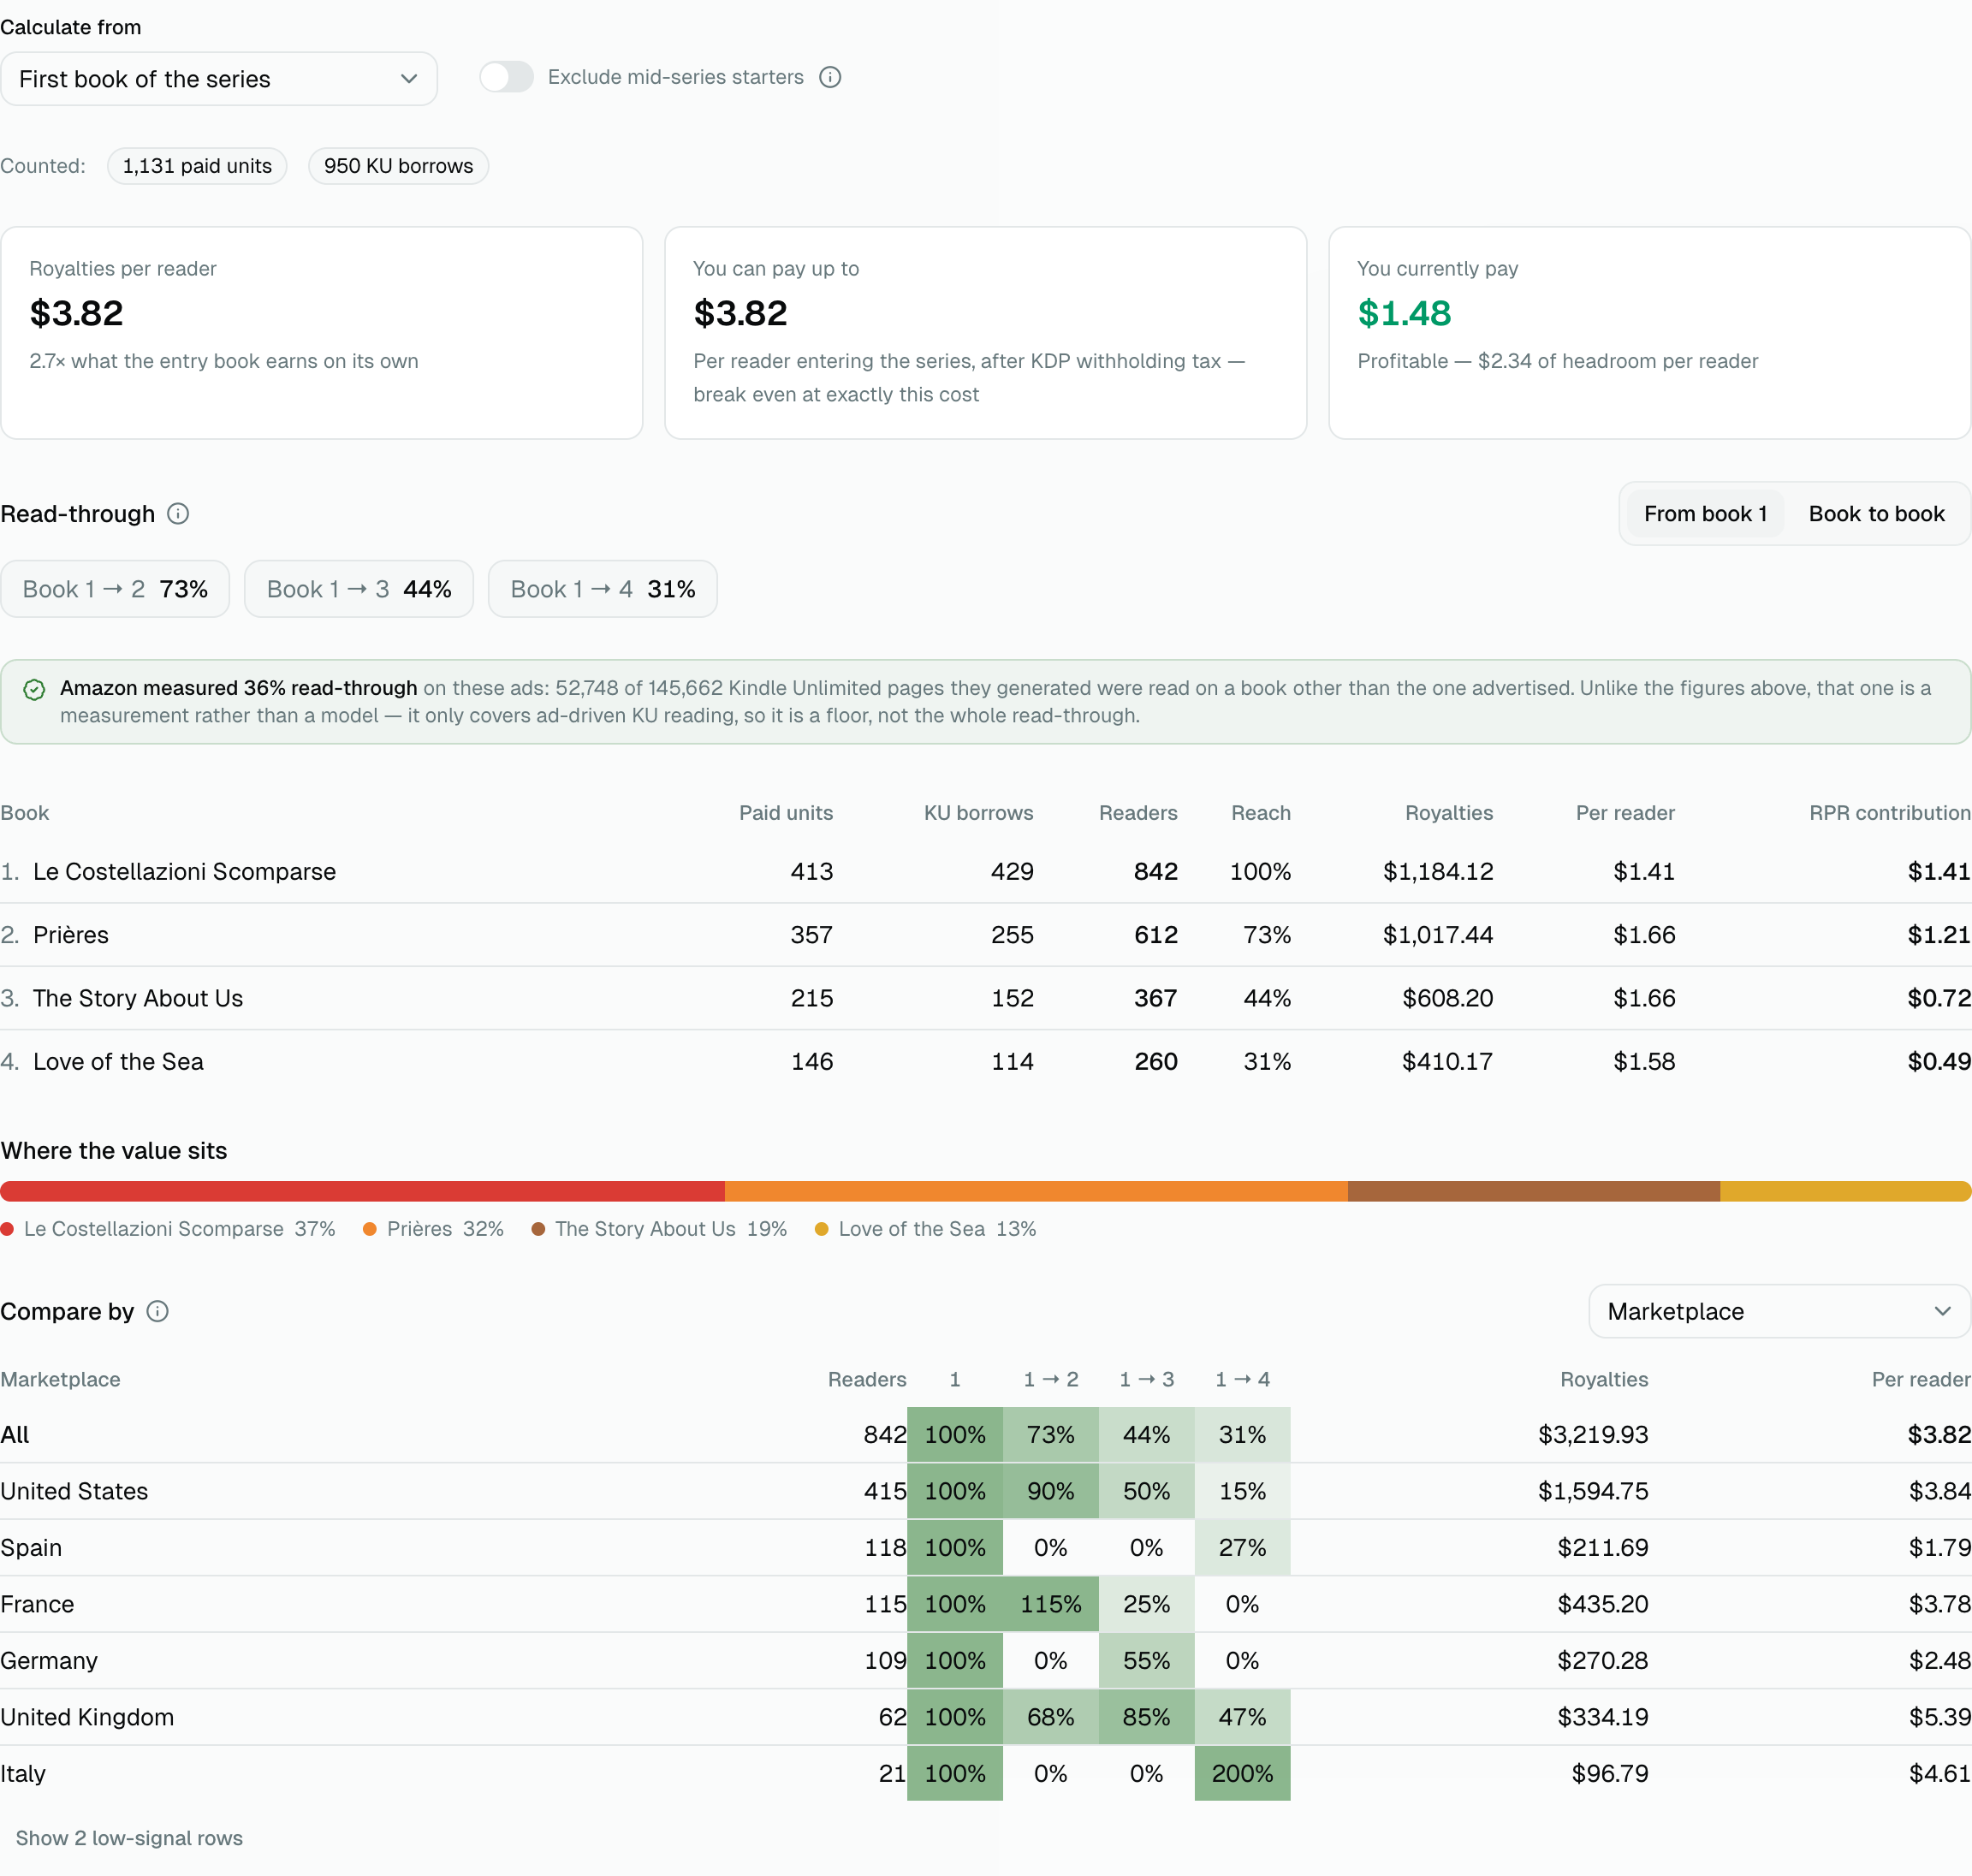
Counted says exactly what went into the figures — how many paid copies, how many Kindle Unlimited borrows. If you switch on Exclude mid-series starters, it also tells you what percentage that removed.
The ladder repeats the read-through for this series, with the same two ways of reading it. Then the per-book table:
| Column | Meaning |
|---|---|
| Paid units | Copies sold |
| KU borrows | Whole Kindle Unlimited reads, estimated from pages |
| Readers | Paid units + KU borrows |
| Reach | Share of entry-book readers who got this far |
| Royalties | What the book earned over the range |
| Per reader | Royalties ÷ readers of that book |
| RPR contribution | What this book adds to the series' royalties per reader |
A book with no estimated readers is marked Excluded: its royalties are real, but there is no reader count to attribute them to.
Under it, Where the value sits turns that last column into one bar. It answers a question the table makes you do in your head: is this series carried by book 1, or by its tail? The first tells you to keep advertising; the second tells you to write the next book.
Compare by marketplace, format of sale, or year
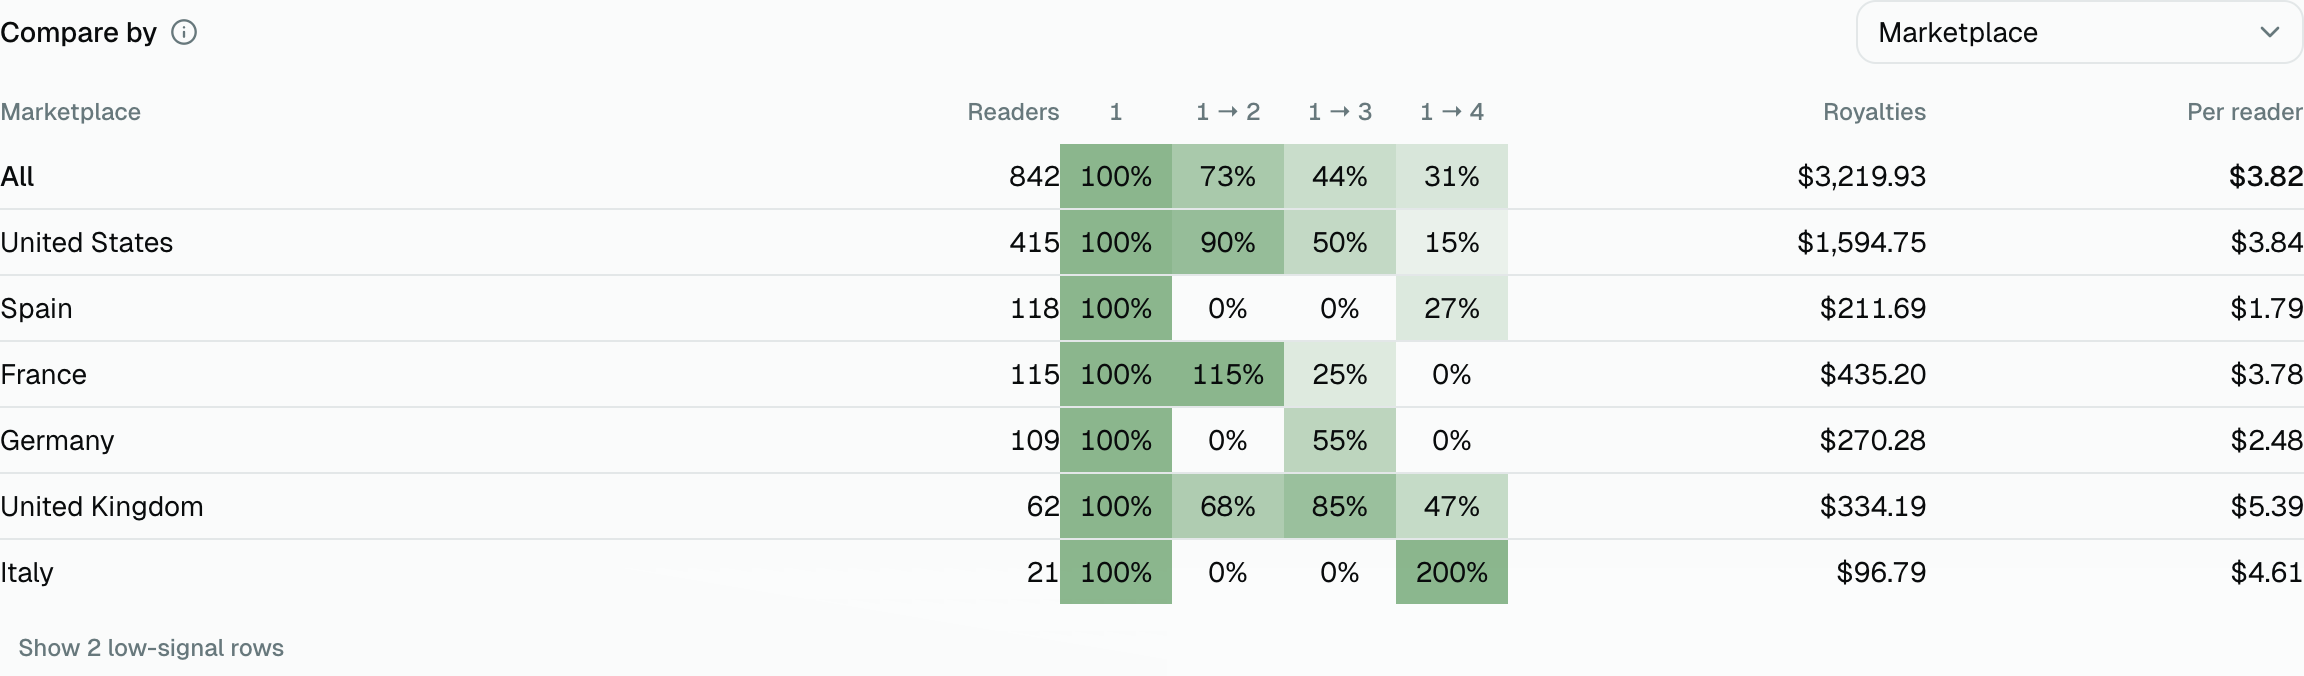
One read-through figure for a whole series hides the decision. A funnel that holds in the United States and collapses in Germany is two different businesses — and it is almost certainly being advertised with the same bid in both.
Compare by recalculates the whole funnel for each value on its own:
| Compare by | Answers |
|---|---|
| Marketplace | Where your series actually keeps readers, and what one is worth there |
| Sales vs Kindle Unlimited | Whether your read-through is a paid story or a KU one — they usually differ |
| Year | Whether the funnel is improving or decaying as the series ages |
Every row is a separate calculation, using only the units, page reads and royalties from that value. So the rows do not add up to the All line — they are alternatives to it, not slices of it.
Rows built on very few readers are hidden: under 25 readers a single borrow moves the percentage several points, which is arithmetic rather than a measurement. The count is always shown, and one click reveals them.
By format is deliberately not offered. We would only know a title's main format, not the format of each individual sale, so a "by format" table would put a book's hardcover sales under paperback and look perfectly convincing.
Royalties per reader, and what you can pay
Royalties per reader (RPR) is the total one reader entering the series generates across every later book. It is the number you bid with.
Beside it sits the decision: what you can pay up to — the same figure after KDP withholding tax, which is the most you can spend to acquire one entry reader and still break even — against what you currently pay (ad spend ÷ entry readers). Green means every reader you buy makes money.
Two ways to model it
Calculate from — model a reader entering at book 3 instead of book 1, for example when book 1 is retired or permafree.
Exclude mid-series starters — a later book can legitimately show more readers than the one before it (its own ads, a promo, readers starting mid-series), which flatters RPR. Turn this on and each book is capped at the previous one, its royalties scaled down to match; adjusted books are badged Adjusted N%, and the Counted line tells you what share of readers left the calculation.
Neither one touches the read-through ladder. That is an observation of what happened; these two change how it is modelled into a per-reader value, and a model must never quietly rewrite the measurement it started from. A step above 100% is real — it is exactly what the second option is for.
What counts as a reader
Readers = paid units + floor(KENP pages read ÷ KENPC)A Kindle Unlimited borrow earns pages, never a unit — so it has to be converted. KENPC is the normalized page count of your book; KDP shows it on your Bookshelf but never in a report, so you enter it once per title in Manage series. Partial reads are rounded down: half a book is not a reader.
Without KENPC we count paid units only, and say so — the series is marked understated rather than quietly wrong. If you are KU-first, fill it in.
Include free units, in a series' detail, also counts free downloads as readers — in a series whose first book is free, that is where most readers start. They add readers, never royalties, and the panel shows how many it counted. Per-title free counts from Kobo and Draft2Digital are whole-month totals, so they can include days outside your range; the panel says so.
What Amazon itself measured
Everything above is a model built from totals. Amazon publishes one figure that is a genuine measurement: of the Kindle Unlimited pages your ads generated, how many were read on a book other than the one advertised. That is series read-through, observed rather than inferred, and it appears in the panel whenever Amazon reports any.
Treat it as a floor. It only covers KU reading that an ad drove — not paid sales, not organic reading — so the real read-through is always larger. Its value is as a second opinion: it comes from a different source than the ladder above, so when the two agree you can trust the picture.
Nothing to enable, and it costs no extra sync.
Honest limitations
Amazon never reveals who your readers are. Read-through here is a ratio of totals over a window, not a tracked cohort: nobody — no tool on this market — can prove the same person moved from book 1 to book 2. A reader who starts book 1 in January and finishes book 4 in June is spread across both.
It is still the right signal for a decision — just do not read it as if each reader were followed individually.
Showing or hiding the page
Settings → Preferences → Series section: Always show, Always hide, or Hidden until you create a series. The page stays reachable by link either way.