
Build your own dashboard
Pin any chart from Comparison — the world map included — or the Marketplaces table, to the bottom of your dashboard, and arrange them the way you work.
The top of your dashboard is fixed on purpose: it answers "am I making money". Underneath it, you decide what else you want to see every day.
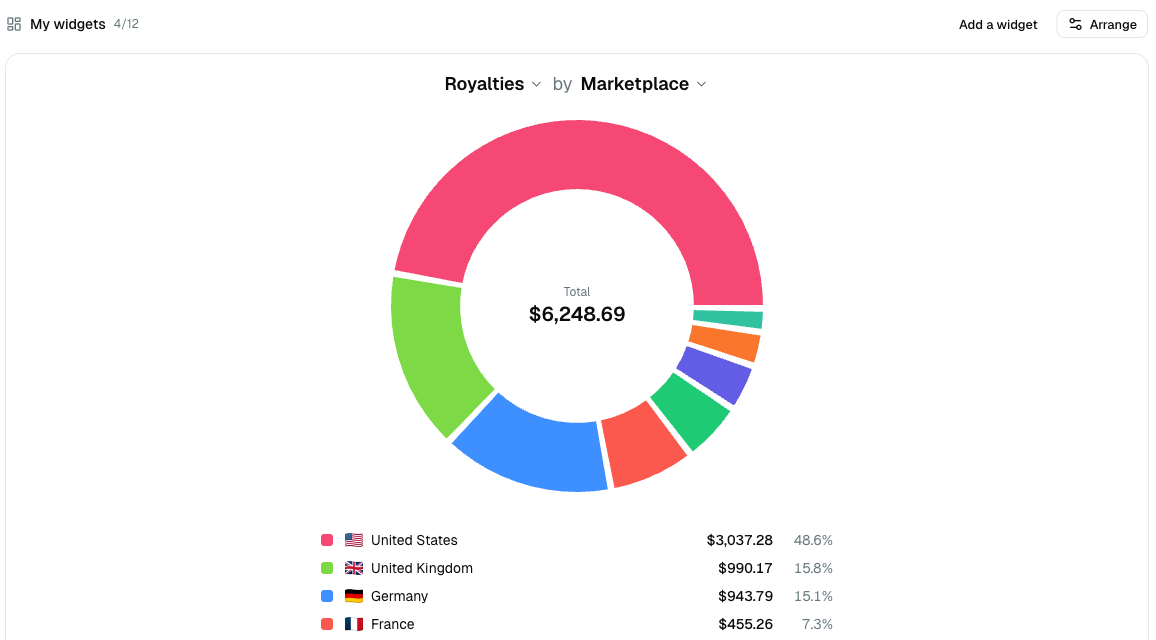
Pin a view
Go to Comparison or Marketplaces, set the view up exactly as you want it, then click Add to Dashboard.

What gets saved is the view itself — the metric, the breakdown, the toggles, and the column a table is sorted by. Set a timeline to All time and Cumulative before pinning it, and that is how it comes back.
Once a view is pinned, the same button reads Remove from Dashboard. Clicking it unpins the view. There is no confirmation, because the same button puts it straight back.
You can pin up to 12 widgets.
Your widgets follow the dashboard's filters
A widget is part of the page, not a snapshot of the day you created it. Change the date range, the currency, the marketplace or the distribution channel at the top of the dashboard, and every widget moves with it — so a widget can never disagree with the cards above it.
Two things are worth knowing:
- Some views are all time by nature — a year-over-year timeline, the leverage curve, or a breakdown by publication year. Those carry an All time badge, so you know the date range is not being ignored by accident.
- Book and format filters are saved with the widget, because the dashboard has no such filter. That is what lets you pin "Royalties by marketplace, for this one book".
- A widget that cannot answer under your current filter says so instead of showing zeros. Net profit, Ad spend and True ACOS all need Amazon ad spend, and a distribution set to Kindle Unlimited or Expanded Distribution alone has none — include Retail to bring those widgets back.
Arrange, rename, remove
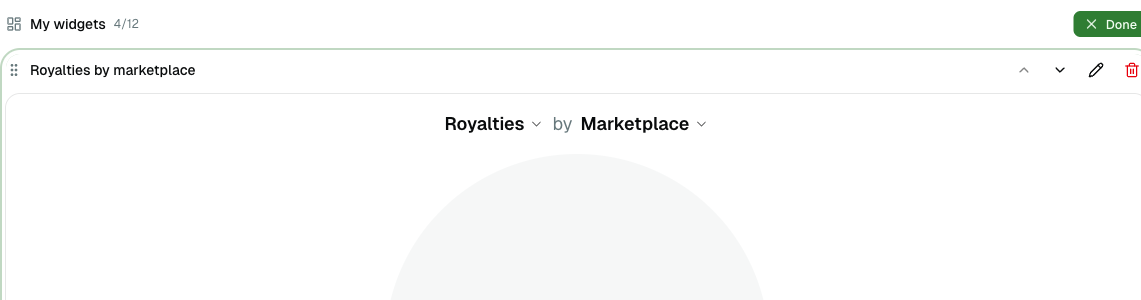
Click Arrange and every widget gets a header bar. Grab it anywhere — the grip is just the hint, not the only spot — and drag the widget where you want it. It follows your cursor in both directions while you move it, and drops into the nearest slot when you let go.
The buttons on that bar keep their own job:
| Control | What it does |
|---|---|
| ↑ ↓ | Move it one place, without dragging |
| ✎ | Give it your own name |
| 🗑 | Remove it from the dashboard |
Click Done when you are finished. Your data is never touched — removing a widget only removes the card.
Changes are saved as you make them
Changing a widget's metric, its breakdown, its toggles or a table's sort column is saved immediately. When you come back, you find your dashboard the way you left it.
The one exception is the year checkboxes under a year-over-year chart: those hide a line while you read, and are not remembered.