
Comparison
Slice any metric by book, marketplace, format, platform, publication year or period — the free-form view for questions the other pages do not answer.
Every other page answers a fixed question. Comparison lets you build your own: pick a metric, pick a dimension, and see the split.
Metrics
| Metric | What it counts |
|---|---|
| Net profit | What you kept: royalties minus ad spend and expenses |
| Royalties | What Amazon paid you, before ad costs |
| Units | Copies sold |
| Ad spend | What your Amazon Ads cost, VAT included |
| Impressions | How many times Amazon showed your ads |
| Average CPC | What you paid, on average, for one click — on Over time and Catalog leverage only |

Impressions are the top of the funnel — reach you paid for, before anyone clicked or bought. Compared against royalties or units, they answer "are my ads being seen and ignored, or not being seen at all?". A book with many impressions and few sales has a cover, blurb or price problem; a book with few impressions has a bidding or keyword problem.
Impressions start on 5 August 2026, when we began importing them from Amazon Ads. Earlier dates show zero until your ad history is re-imported, and the page says so whenever the period you are looking at is affected — so a flat start is never mistaken for "I ran no ads then". Average CPC starts the same day, and leaves earlier dates blank rather than showing them as free.
Average CPC is always a weighted average
Whatever you are looking at — one book, one marketplace, one month, or everything — Average CPC is that scope's total ad spend divided by its total clicks. It is never the average of the numbers below it.
That distinction is not academic. If one book takes 1,000 clicks at $0.10 and another takes 10 clicks at $1.00, your real cost per click is $0.11, not the $0.55 you would get by averaging the two figures. The busy book is what you are actually paying for, so it counts more.
Two consequences you will see:
- Average CPC is not offered on the Donut. A donut shows each slice's share of a whole, and costs per click have no whole — they do not add up. To compare CPC across books or marketplaces, use the Books page, where every row has its own Average CPC column.
- No Quarterly or Cumulative on the timeline. Those add months together, and adding CPCs gives a meaningless number.
Our figure includes the VAT Amazon charges on ads, so it reads slightly higher than the CPC in your Amazon Ads console. That is what the click really cost you — see Taxes and currencies.
Dimensions
| Dimension | Answers |
|---|---|
| Book | Which titles carry the catalog |
| Marketplace | Which countries pay |
| Format | Ebook, paperback, hardcover or audiobook |
| Platform | Which platform the money came from — the stores you sell on, the networks you advertise on |
| Publication year | Does the backlist still earn? |
| Month / Date | How the split moves over time |
Four views
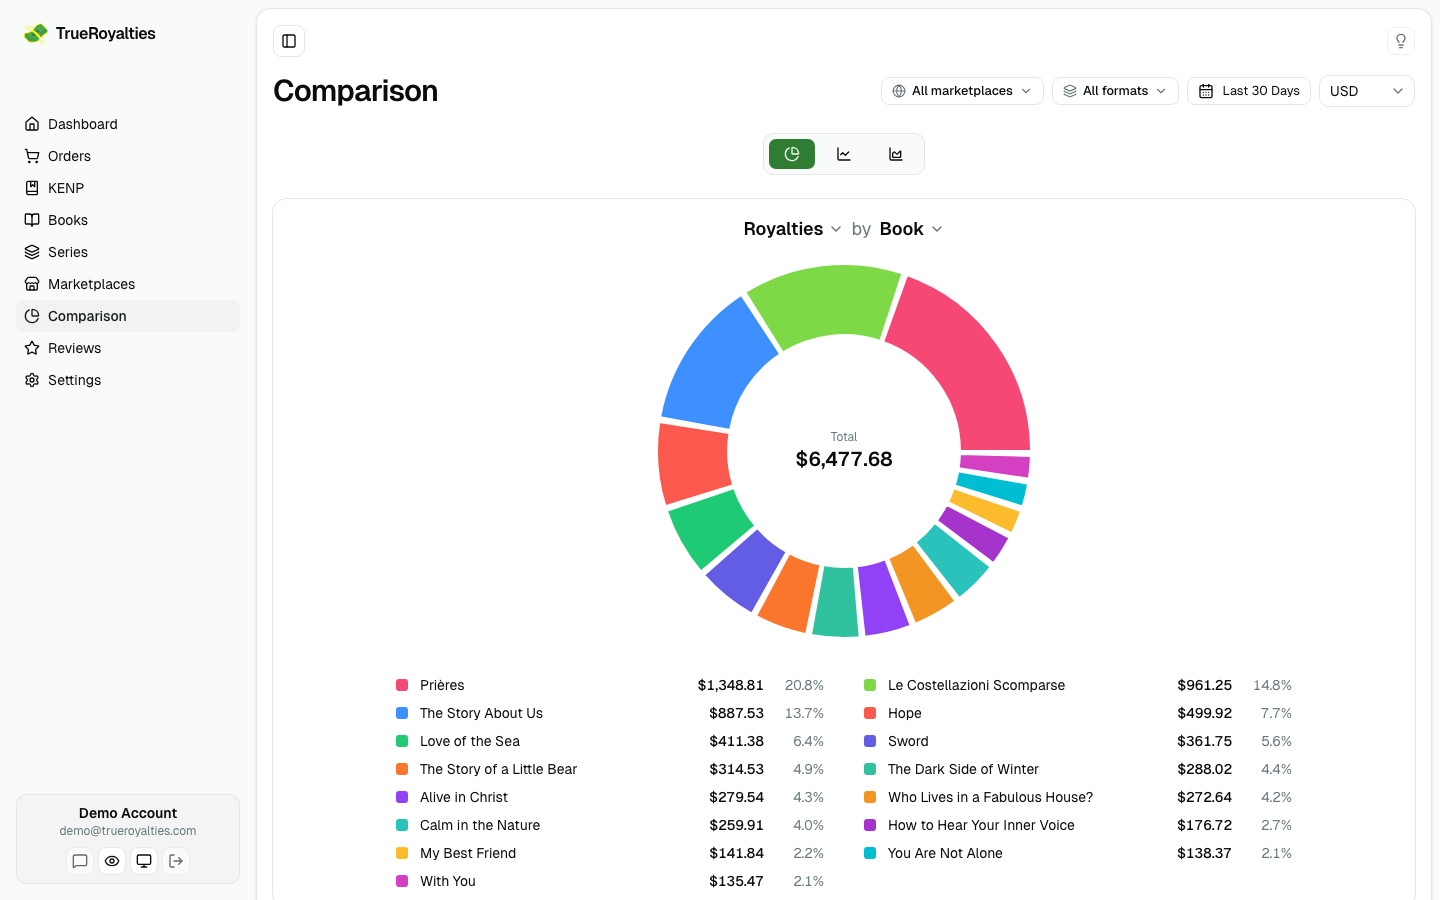
- Donut — a ranked legend and each slice's share of the total.
- Over time — the same metric month by month, with a year-over-year option.
- Catalog leverage — how much of one thing produces how much of another, for example how many titles produce most of the ad spend.
- World map — the same figures on a map, always by marketplace.
The world map
Pick the globe icon and the breakdown becomes geography: every Amazon storefront you sell on, shaded by how much it brought in. The numbers are the same ones the donut shows for the same filters — it is another way to look at them, not another calculation.
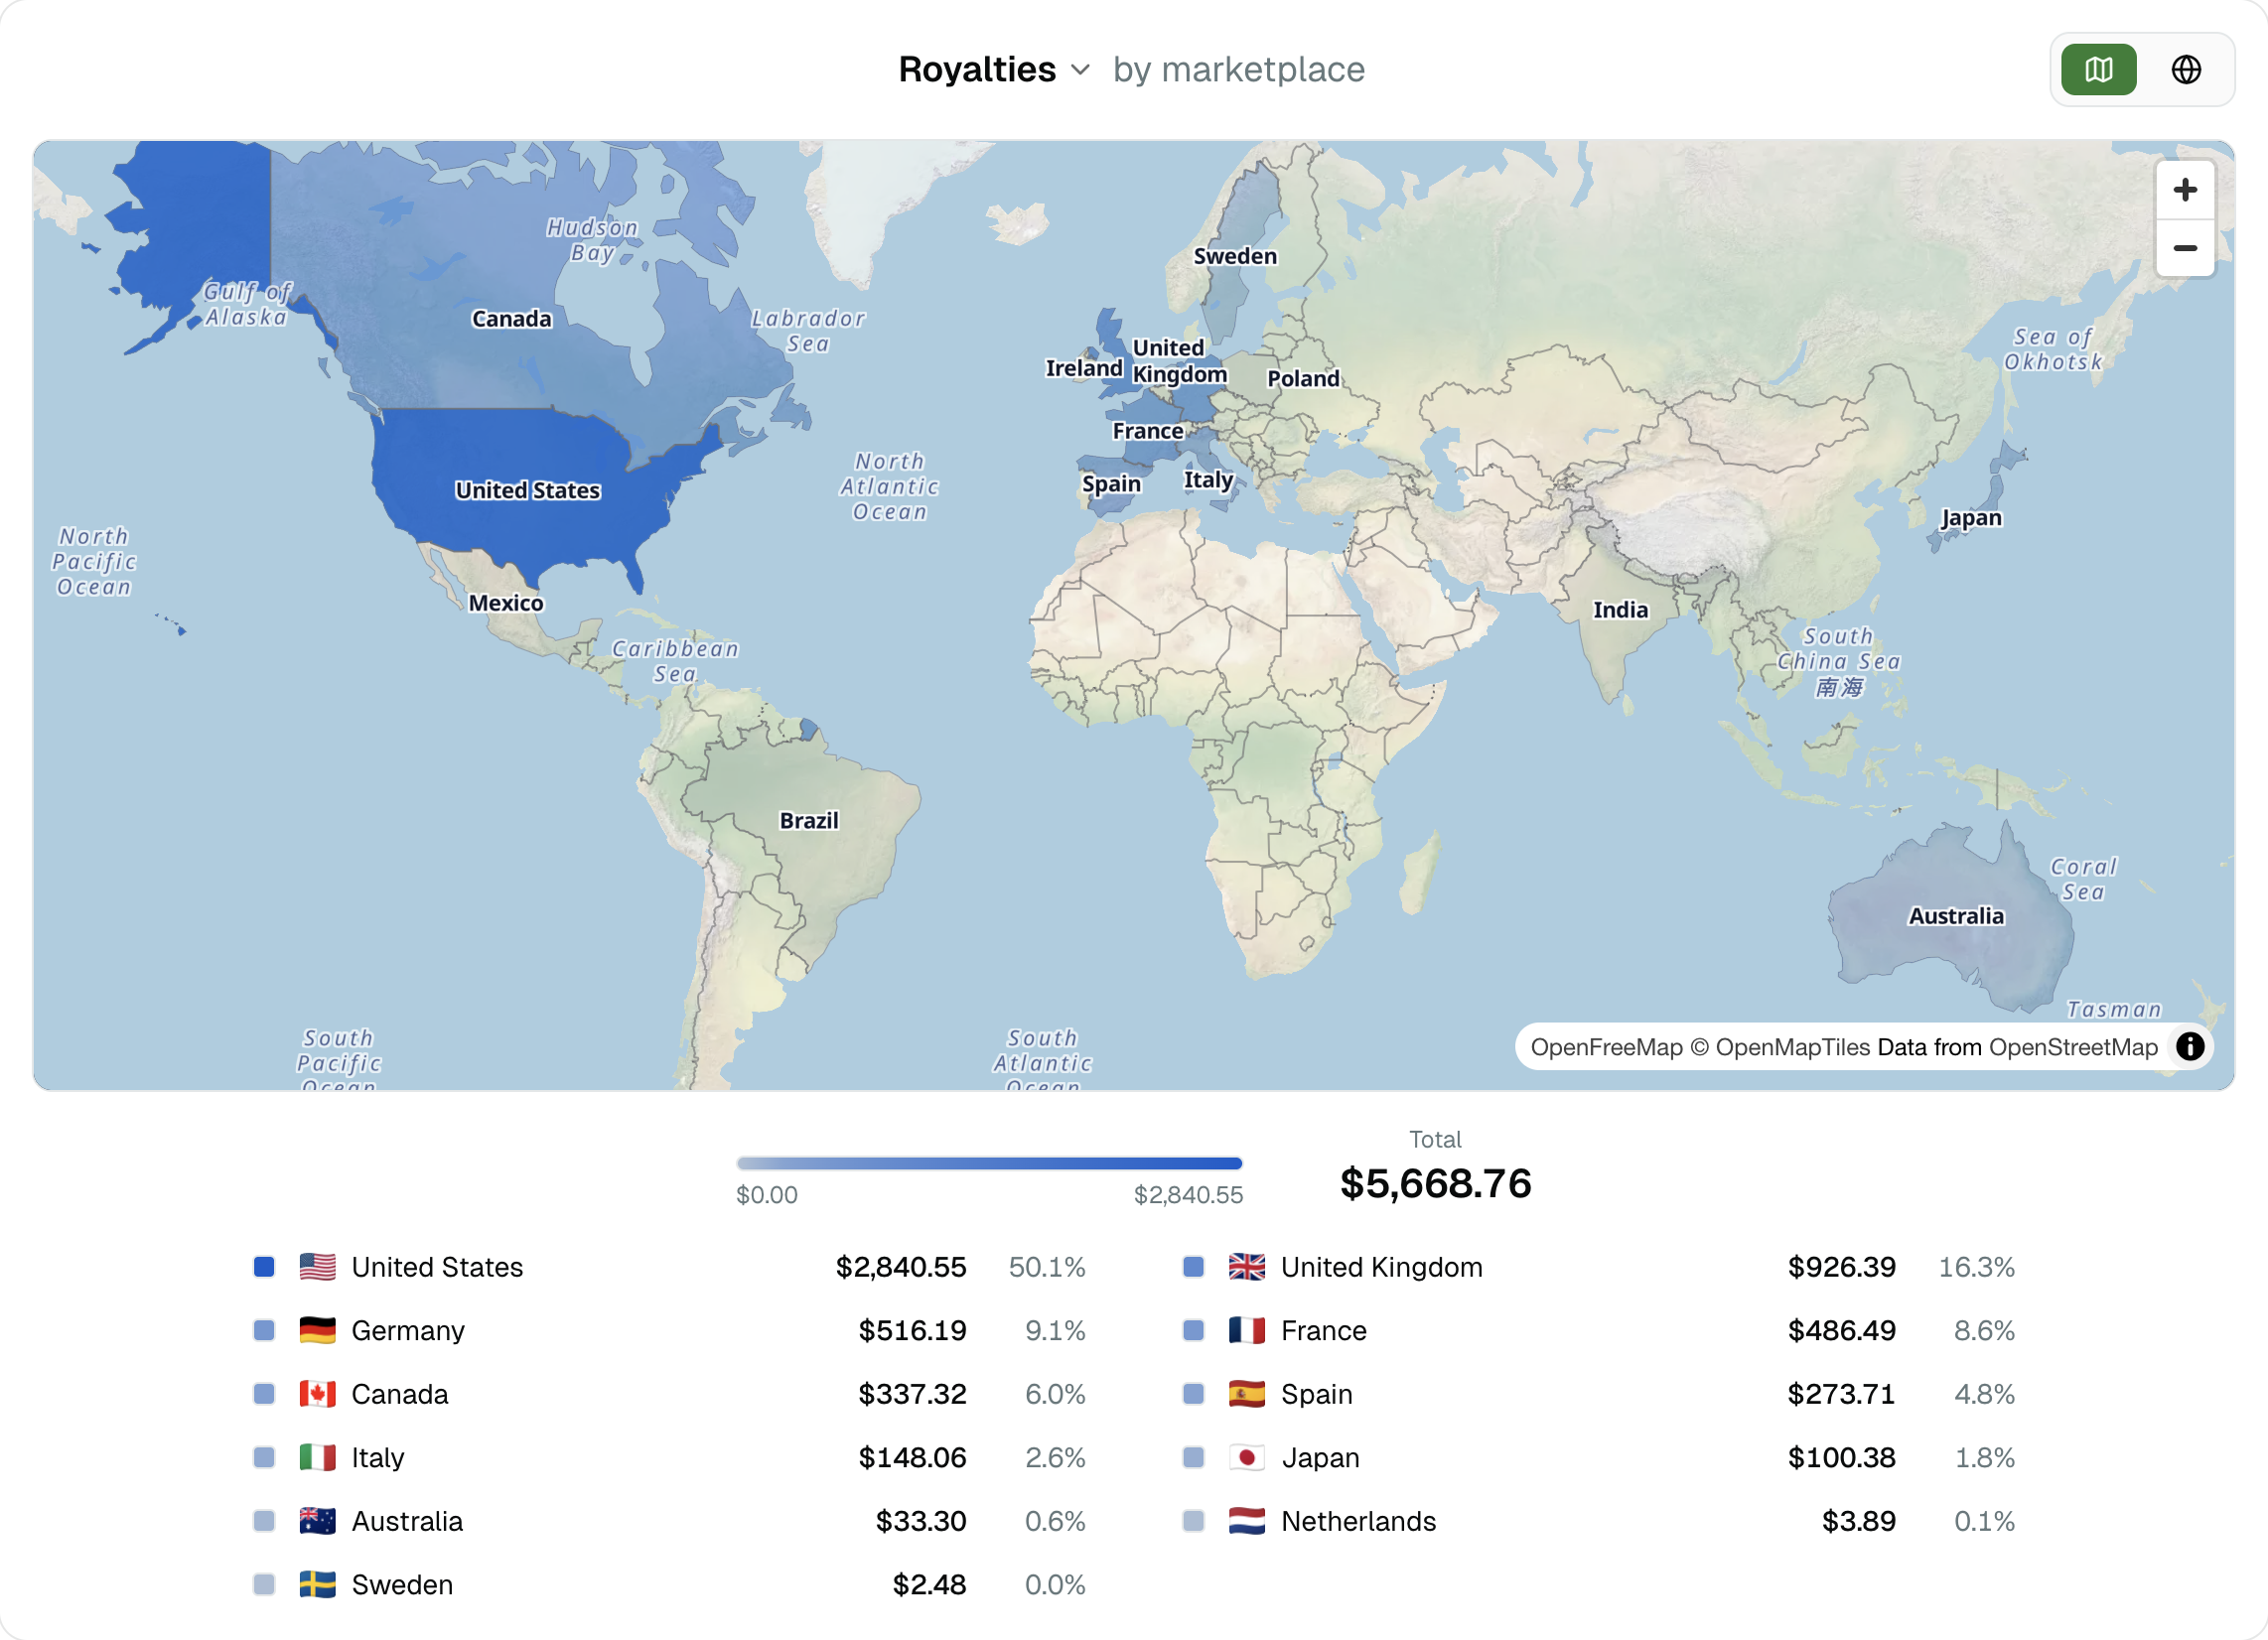
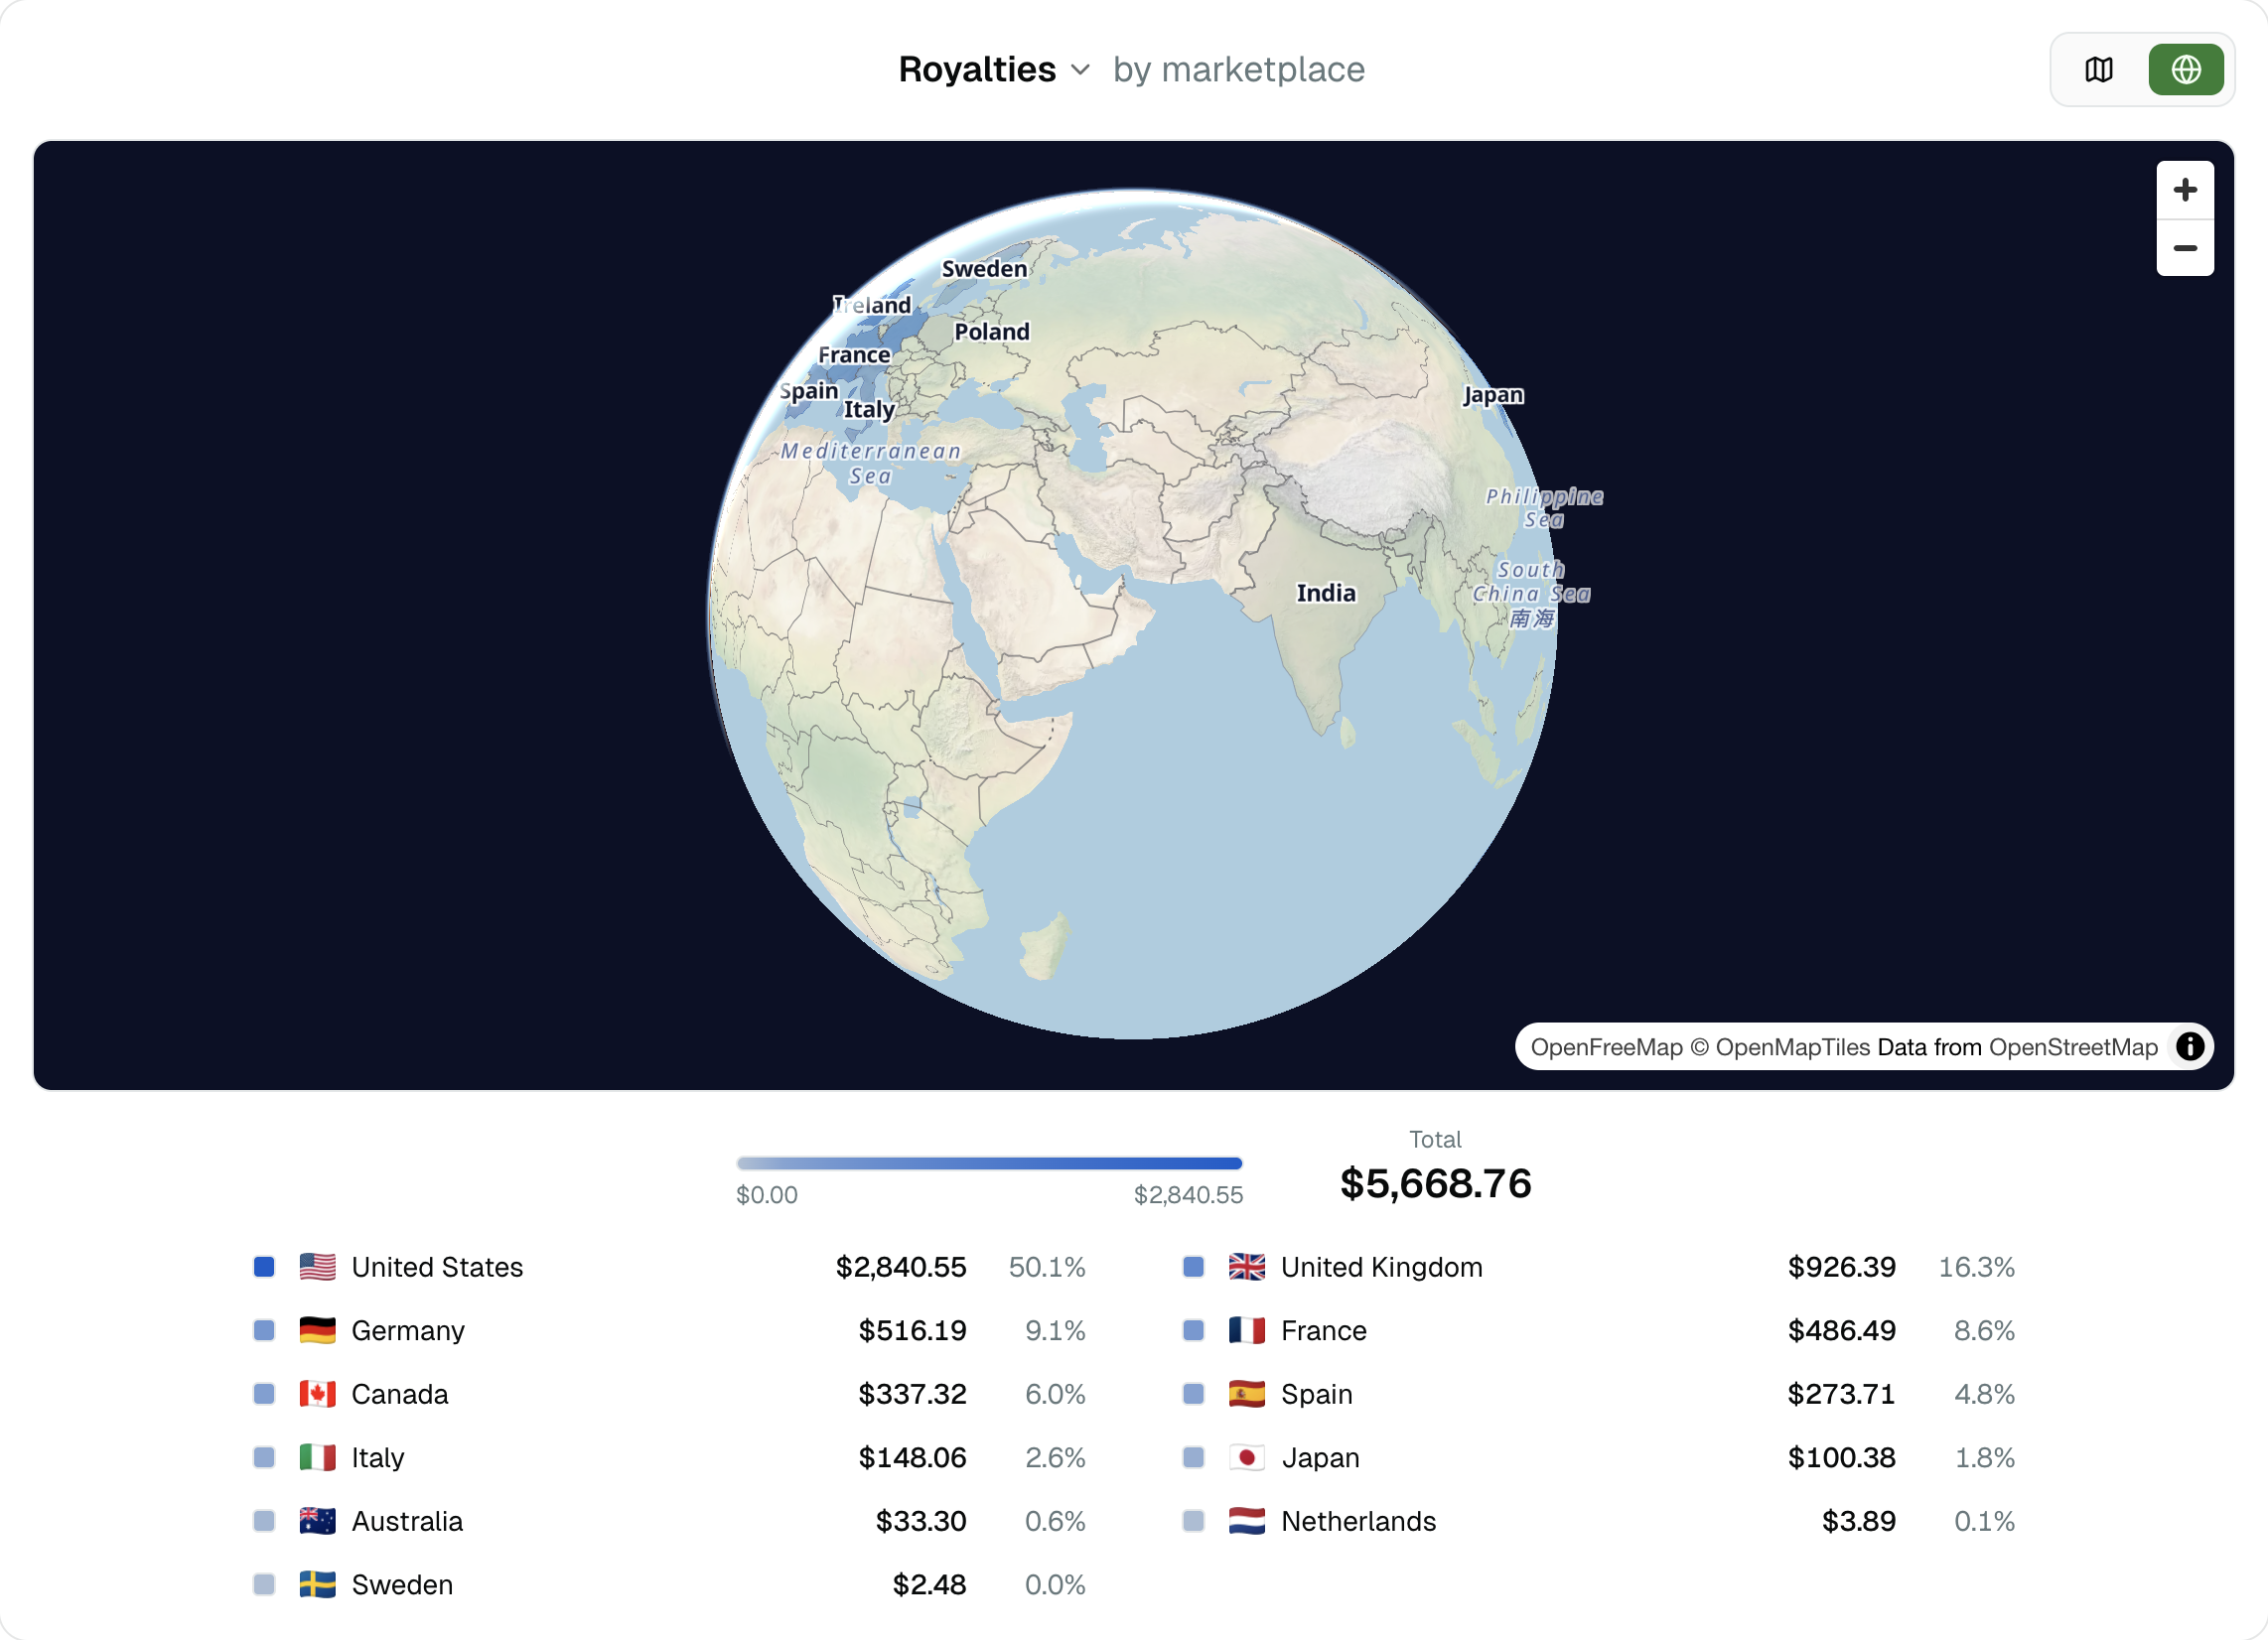
A button in the corner of the card switches between the flat map and a globe that turns on its own. It stops while you point at a country, and starts again a few seconds after you let go.
Reading it:
- The darker the country, the more it brought in. The scale under the map runs from zero to your best storefront.
- Net profit is the one metric that can go red. A country in red lost money there — ads cost more than the royalties they earned. (This is the only view that can show that: a donut splits a positive total, so it has to refuse.)
- Grey means two different things. A storefront that sold nothing in the period is a shade darker than a country where Amazon has no store at all — point at it and the map says which.
- Only the countries you can sell in are named, so the map answers "where do I earn?" rather than naming every country on Earth.
- Hover any country for its figure and its share; hovering a row in the list highlights it on the map.
A group we cannot place on a country — an unknown storefront, or sales recorded before Amazon told us where they happened — is still listed and still counted in the total. It is never dropped silently.
Format is per sale, not per title
A title sold in both paperback and hardcover is one book, but its sales are split by the format actually bought. So the format breakdown reflects what readers chose, not how you catalog the title.
Filters
Marketplace, format and date range, on top of the dimension you pick. The selection lives in the URL, so a view you like can be bookmarked. The world map hides the marketplace filter — the map already is the split by marketplace.
Keep a view on your dashboard
Found a view you want every day? Click Add to Dashboard and it is pinned to the bottom of your dashboard, toggles and all — see Build your own dashboard.